*1 Scopes are categories of GHG emissions prescribed by the GHG Protocol.(The GHG Protocol was developed as an international standard for calculating and reporting GHG emissions)
Scope 1:Direct emissions from business activities
Scope 2:Indirect associated with the use of energy (electric power, heat, etc.) in business activities
Scope 3:Other indirect emissions caused by supplier activities, product use, etc.
CO2 Emissions at Construction Sites(Non-consolidated)
Unit
FY2014.3 (Base year)
FY2017.3
FY2018.3
FY2019.3
FY2020.3
FY2021.3
CO2 Emissions at Construction Sites
Total amount of CO2 emissions
1,000t-CO2
229
190
211
186
188
164
Amount of emissions per completed work
t-CO2/ billions of yen
210
150
170
140
140
140
CO2 emissions reduction rate(vs. FY2014.3)
%
-
16.8
8.0
18.8
17.9
28.3
Composition of CO2 Emissions Sources at Construction Sites
Electric Power
%
29.1
28.4
31.5
28.9
30.8
Diesel fuel
69.6
70.6
66.9
69.8
66.3
Material/ waste transport
21.3
24.7
25.1
28.9
22.1
Drilling machinery
25.5
23.5
18.5
17.7
18.2
Other construction machinery
22.8
22.4
23.3
23.6
26.0
Kerosene
1.3
1.0
1.6
1.3
2.9
KPI
Direct contribution(*3) of CO2 emissions reduction rate(vs. FY2014.3)
%
-
31
36
47
55
67
*3 Direct contribution = A + B - C
A Use of fuel at construction sites and offices, and purchases of electric power (Scope 1 + Scope 2)
B Construction/waste material transportation and employee/worker commuting (Categories 4, 7, and 9 of Scope 3)
C Emissions volume corresponding to amount of electricity generated by renewable energy business
CO2 Emissions Reduction of Designed & Constructed Buildings
Unit
FY2017.3
FY2018.3
FY2019.3
FY2020.3
FY2021.3
Number of designed buildings
cases
57
42
35
41
57
Total area of designed buildings
1,000m²
1,431
833
735
1,722
1,457
Amount of CO2 emissions reduced
1,000t-CO2/year
27
17
10
31
33
CO2 emissions reduction rate(*4)
%
22.9
25.8
19.8
34.0
23.2
KPI
Indirect contribution(*5) of CO2 emissions reduction rate(vs. FY2014.3)
%
13
16
19
21
21
*4 Average CO2 emissions reduction rate calculated by Comprehensive Assessment System for Built Environment Efficiency (CASBEE)
*5 Indirect contribution = a + b - c
a Annual emissions during use of buildings designed and constructed by Obayashi Corporation, assuming they are offered for use for 35 years after completion
b Production of construction materials (Category 1 of Scope 3)
c Reduction resulting from adoption of energy-conserving renovation or low-carbon materials
CO2 Emissions at Offices(*6), etc.(Non-consolidated)
Unit
FY2017.3
FY2018.3
FY2019.3
FY2020.3
FY2021.3
CO2 emissions
1,000t-CO2
7.5
6.8
6.3
7.3
6.6
Electric power consumption
kWh/person
1,328
1,220
1,250
1,322
1,098
*6 Applicable facilities in this ESG DATA BOOK:Head Office, Main Offices, other branch offices, robotics centers, material/equipment centers, and Technical Research Institute
Resource Circulation
Tap Water Consumption Reduction
Unit
FY2017.3
FY2018.3
FY2019.3
FY2020.3
FY2021.3
Construction sites
m³/billions of yen
2,590
2,340
2,640
2,330
2,420
Civil engineering
m³/billions of yen
1,800
1,450
2,050
1,320
1,720
Building construction
m³/billions of yen
790
890
590
1,010
700
Office
m³/person
4.2
4.3
4.3
4.2
2.7
Paper Consumption Reduction(Consolidated)
Unit
FY2017.3
FY2018.3
FY2019.3
FY2020.3
FY2021.3
Total amount of paper consumption
t
326
321
310
341
232
Obayashi
265
258
251
281
177
Group companies
61
63
59
60
55
Paper Consumption Reduction at Offices(Non-consolidated)
Unit
FY2017.3
FY2018.3
FY2019.3
FY2020.3
FY2021.3
Total amount of paper consumption
kg/person
47
46
45
51
30
Recycled paper
44
43
42
47
26
Others
3
3
3
4
4
Recycled paper consumption rate
%
93.6
93.5
93.3
92.2
86.7
Waste Emissions(Consolidated)
Unit
FY2017.3
FY2018.3
FY2019.3
FY2020.3
FY2021.3
Total amount of waste emissions
1,000t
2,870
2,550
2,290
2,160
2,211
Obayashi
2,560
2,360
2,050
1,870
1,930
Group companies
310
190
240
290
281
Construction Waste Emissions(Non-consolidated)
Unit
FY2017.3
FY2018.3
FY2019.3
FY2020.3
FY2021.3
Amount of Construction Waste Emission, Final Disposal and Recycling Rate (Excluding construction sludge)
Construction waste emissions
1,000t
1,563
1,342
1,301
1,021
1,152
New building construction
175
181
176
241
180
Demolition
1,388
1,161
1,125
780
972
Final disposal
1,000t
43
46
46
41
31
Recycled amount
1,000t
1,520
1,296
1,255
980
1,120
Recycling rate
%
97.2
96.6
96.5
96.0
97.2
Breakdown of Waste Emissions by Type
Construction waste emissions
1,000t
1,563
1,342
1,301
1,021
1,152
Concrete debris
1,120
950
971
697
807
Asphalt and concrete debris
152
159
131
123
122
Wood scraps
49
45
37
28
41
Other sorted waste
206
150
117
128
152
Mixed waste
36
38
45
45
29
KPI
Emissions of construction waste material per unit value of completed construction work (excluding construction sludge)
t/billions of yen
142
147
131
178
127
Construction Waste and Construction Sludge Disposal / Recycling Ratio by Type
Unit
FY2017.3
FY2018.3
FY2019.3
FY2020.3
FY2021.3
Concrete debris
Final disposal
%
0.1
0.5
0.1
0.1
0.0
Reduction
0.0
0.1
0.0
0.1
0.1
Recycle and reuse
99.9
99.4
99.9
99.8
99.9
Asphalt and Concrete debris
Final disposal
%
0.1
0.1
0.2
0.2
0.2
Reduction
0.0
0.0
0.0
0.0
0.0
Recycle and reuse
99.9
99.9
99.8
99.8
99.8
Wood scraps
Final disposal
%
0.3
0.5
0.6
0.6
0.3
Reduction
1.9
1.8
1.6
2.7
2.2
Recycle and reuse
97.8
97.7
97.8
96.7
97.5
Other sorted waste
Final disposal
%
16.1
21.0
23.1
22.7
15.8
Reduction
0.8
1.4
2.7
0.8
0.7
Recycle and reuse
83.1
77.6
74.2
76.5
83.5
Mixed waste
Final disposal
%
24.6
25.0
39.0
32.7
21.2
Reduction
5.4
6.3
4.2
4.4
7.4
Recycle and reuse
70.0
68.7
56.8
62.9
71.4
Construction sludge
Final disposal
%
6.6
1.7
2.5
1.4
2.0
Reduction
27.8
25.5
25.8
22.9
16.4
Recycle and reuse
65.6
72.8
71.7
75.7
81.6
General Waste Emissions
Unit
FY2017.3
FY2018.3
FY2019.3
FY2020.3
FY2021.3
Total amount of waste emissions
kg/person
70
74
67
85
70
Recycling
56
55
50
59
59
Others
14
19
17
26
11
Recycling rate
%
80.0
74.3
74.6
69.4
84.3
Emissions Reducing Management
Unit
FY2017.3
FY2018.3
FY2019.3
FY2020.3
FY2021.3
Zero emissions standards achievement(*7) rate of construction
%
83.1
80.6
75.5
72.0
77.0
Civil engineering (*8)
87.3
84.4
69.9
75.9
88.2
Building construction (*8)
80.5
78.2
78.2
69.9
72.2
Electronic manifests sheets used
thousands of sheets
346
346
318
308
302
Electronic manifests sheets usage rate
%
92.9
94.6
94.1
96.4
97.2
*7 Final disposal rate of construction waste (excluding consruction sludge) is below 5%. That amount of new building construction is below 5kg/m²
*8 Construction waste emissions (excluding construction sludge) below 1,000t of renewal construction and waste emissions (excluding construction sludge) below 10t of civil engineering work is excluded
Chemical Substances Management
Unit
FY2017.3
FY2018.3
FY2019.3
FY2020.3
FY2021.3
Amount of Consumption of Substances Subject to the PRTR Law (*9)
kg
973
1,361
1,596
1,302
1,219
Xylene
308
317
348
169
216
Toluene
121
253
381
346
332
Ethylbenzene
42
85
92
57
60
Trimethylbenzene
226
227
226
287
183
Others
276
479
549
443
427
Asbestos Processed
t
2,249
3,628
1,141
1,617
1,652
CFC and Halon Gases Collected and Processed (*10)
t
8.9
2.9
4.9
4.8
7.5
CFC gas
8.7
2.8
4.1
2.9
5.8
Halon gas
0.2
0.1
0.8
1.9
1.7
PCB waste materials (*11) removal (*12)
units
140
0
0
0
0
Capacitors
140
0
0
0
0
Transformers
0
0
0
0
0
*9 A law to improve the monitoring and management of releases to the environmnet of designated chemical substances
*10 Amount of recycled CFC gas and Halon gas was 1.6t and the amount of disposed CFC gas and Halon gas was 5.9t in FY2021.3
*11 PCB waste materials must be transported to Japan Environmental Safety Corporation, the company designated by the government of Japan
*12 Methods for the storage and disposal are regulated by law because these materials contain polychlorinated biphenyl (PCB), which is a toxic substance
Promoting Environmentally Friendly Businesses
Unit
FY2017.3
FY2018.3
FY2019.3
FY2020.3
FY2021.3
KPI
Ratio of design and built projects (of 2,000m² and up) with CASBEE ranking of A or higher
%
66
71
67
75
64
KPI
Ratio of sustainability - related capital expenditure to real estate leasing business capital expenditure
%
95.0
98.0
91.0
92.7
93.6
Promoting Renewable Energy Businesses
Unit
FY2017.3
FY2018.3
FY2019.3
FY2020.3
FY2021.3
KPI
Electricity generated annually as a result of renewable energy businesses
MWh
97,516
161,686
201,353
255,551
267,202
Capital expenditure of renewable energy business and others
billions of yen
7.0
14.5
12.5
13.4
9.5
Environmental Accounting
Unit
FY2017.3
FY2018.3
FY2019.3
FY2020.3
FY2021.3
Cost of environmental protection (a~f)
millions of yen
31,087
40,183
31,110
32,443
28,122
Cost within business area (a)
24,679
33,121
23,845
24,536
20,631
Preventing pollution
8,443
13,729
5,939
6,016
3,376
Protecting the global environment
466
629
453
468
354
Recycling resources
15,770
18,763
17,453
18,052
16,901
Upstream and downstream cost
Environmental design elements
1,591
1,711
1,729
1,858
1,750
Cost of management activities
954
1,695
925
712
719
Operating EMS
135
131
152
122
113
Information disclosure / environmental advertisements
98
76
91
65
84
Supervision and measurements
253
680
258
102
159
Environmental education
10
7
10
10
8
Improving surrounding appearance of construction site
84
410
68
53
42
Departments associated with environmental activities
374
391
346
360
312
R&D costs (d)
Environmental R&D activities
3,722
3,594
4,339
5,289
4,987
Social activities costs(e)
Contributions and assistance for environmental organizations
5
7
6
5
5
Cost of correcting environmental damage (f)
136
55
266
43
31
Nature restoration activities
104
19
260
32
26
Allowances & insurance for damage to the environment
32
36
6
11
5
Environmental Performance Indicators
Unit
FY2017.3
FY2018.3
FY2019.3
FY2020.3
FY2021.3
CO2 emissions (*13)
millions of yen/t-CO2
6.46
5.95
7.18
6.96
7.25
Construction waste emissions (*14)
millions of yen/t
6.89
6.90
7.60
5.61
7.86
*13 CO2 emissions calculation formula:Total sales from a project divided by CO2 emissions during construction
*14 Construction waste emissions:Total sales from a project divided by volume of construction waste emissions (excluding construction sludge) produced when constructing a new building
Environmental Compliance
Unit
FY2017.3
FY2018.3
FY2019.3
FY2020.3
FY2021.3
Violations of environmental laws (*15)
cases
1
6
2
3
1
Fines
0
0
0
0
0
Total monetary value of fines
yen
0
0
0
0
0
Others (compensation payment)
cases
0
0
0
0
1
*15 Violations of environmental laws includes the following: 「When received an administrative guidance」「When a written apology must be submitted」「When a government agency has submitted a recommendation to take corrective actions」「When a small fine must be paid」「When there is a penalty involving more than a small fine」
Biodiversity
Unit
FY2017.3
FY2018.3
FY2019.3
FY2020.3
FY2021.3
Cost of biodiversity conservation project
millions of yen
-
47
67
43
38
Impact on Environmental Protection
Input
Unit
FY2017.3
FY2018.3
FY2019.3
FY2020.3
FY2021.3
Energy consumption
TJ(*16)
3,176
3,508
3,192
3,311
2,935
Construction sites
TJ
3,031
3,375
3,061
3,178
2,809
Offices, etc.
144
132
130
132
126
Water consumption
1,000m³
1,284
1,327
1,231
1,505
1,146
Construction sites
1,225
1,267
1,171
1,444
1,105
Offices, etc.
59
60
60
61
41
Input amount of specified controlled substances
t
-
53,519
23,381
21,776
4,223
Output
Unit
FY2017.3
FY2018.3
FY2019.3
FY2020.3
FY2021.3
CO2 emissions (Scope1+2+3)
1,000t-CO2
197.7
217.4
2,072.9
2,052.8
2,739.4
Scope1
135.6
151.3
127.6
134.1
113.8
Construction sites
134.9
150.8
127.3
133.7
113.5
Offices, etc.
0.7
0.5
0.3
0.4
0.3
Scope2
62.1
66.1
64.5
61.2
56.6
Construction sites
55.3
59.8
58.6
54.3
50.4
Offices, etc.
6.8
6.3
5.9
6.9
6.2
Scope3
-
-
1,880.8
1,857.5
2,569.0
SOX emissions
t
174
193
170
179
153
Construction sites
169
189
166
175
149
Offices, etc.
5
4
4
4
4
NOX emissions
t
993
1,110
948
1,013
840
Construction sites
981
1,099
937
1,002
830
Offices, etc.
12
11
11
11
10
Total amount of emissions
1,000t
2,554.4
2,357.4
2,046.4
1,864.5
1,930.1
Construction waste
1,000t
2,554
2,357
2,046
1,864
1,929.7
General waste (Office)
1,000t
0.4
0.4
0.4
0.5
0.4
Construction waste final disposal (*17)
1,000t
116
75
72
68
61
Amount of specific chemical substance
t
-
1
2
1
1
Products and services
Unit
FY2017.3
FY2018.3
FY2019.3
FY2020.3
FY2021.3
CO2 emission reduction due to use of environmental design (*18)(*19)
1,000t-CO2
957
586
355
1,063
1,169
*16 Unit for energy: 1 terajoule = 1 × 1,012 joules
*17 Including Construction slugde
*18 Comparison with CASBEE reference figures. Data cover all applications
*19 Figures assume a useful building life of 35 years
Economic Impact
Input
Unit
FY2017.3
FY2018.3
FY2019.3
FY2020.3
FY2021.3
Economic impact of emissions reduction and energy conservation on construction sites
millions of yen
-965
1,022
-986
409
-1,054
Electricity used (*20)
195
302
84
-57
-87
Diesel fuel used (*20)
-1,200
731
-1,097
450
-1,070
Kerosene used (*20)
33
-11
27
-17
72
Material purchased (*21)
6.8
0.0
0.0
33.0
31.0
Output
Unit
FY2017.3
FY2018.3
FY2019.3
FY2020.3
FY2021.3
Benefits from sorting construction site waste
millions of yen
177
447
500
494
432
Gain from sales of waste materials
177
447
500
494
432
*20 Conversions for reductions in volume used from the previous fiscal year are as follows:
Electricity (27yen/kWh) (Source: Price Guidelines for New Electricity Rates by the Home Electric Appliances Fair Trade Conference)
Diesel fuel (109,000yen/kl) , Kerosene (79,000yen/kl) (Source:2021.3 issue of Sekisan Shiryo magazine, published by the Economic Research Association)
*21 Waste materials reused at construction sites have been converted to construction material equivalents as follows:
Construction sludge → Backfilling soil (4,025yen/m³)
Concrete debris → Recycled crushed stone (1,125yen/m³) (Source: 2021.3 issue of Sekisan Shiryo magazine, published by the Economic Research Association)
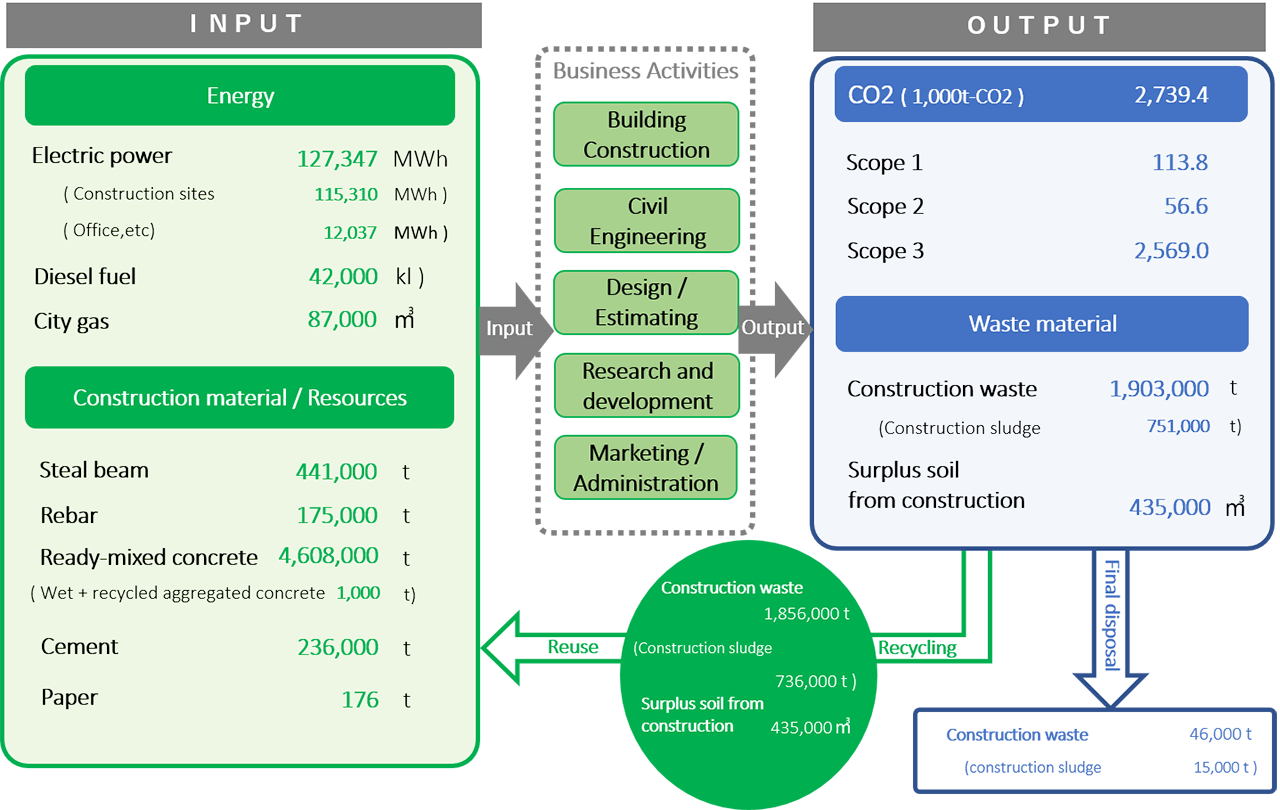
Material Flow
Input
Unit
FY2017.3
FY2018.3
FY2019.3
FY2020.3
FY2021.3
Electric power
MWh
-
130,191
133,113
131,143
127,347
Construction sites
-
117,519
120,622
118,521
115,310
Office,etc.
-
12,672
12,491
12,622
12,037
Diesel fuel
1,000kl
-
58
48
52
42
City gas
1,000m³
-
77
76
78
87
Steal beam
1,000t
-
239
209
348
441
Rebar
-
247
207
233
175
Ready-mixed concrete
-
4,654
4,518
4,030
4,608
Wet+recycled aggregated concrete
-
18
1
2
1
Cement
-
130
76
62
236
Paper
-
0.259
0.251
0.281
0.176
Output
Unit
FY2017.3
FY2018.3
FY2019.3
FY2020.3
FY2021.3
CO2 emissions (Scope1+2+3)
1,000t-CO2
197.7
217.4
2,072.9
2,052.8
2,739.4
Scope1
135.6
151.3
127.6
134.1
113.8
Construction sites
134.9
150.8
127.3
133.7
113.5
Office,etc.
0.7
0.5
0.3
0.4
0.3
Scope2
62.1
66.1
64.5
61.2
56.6
Construction sites
55.3
59.8
58.6
54.3
50.4
Office,etc.
6.8
6.3
5.9
6.9
6.2
Scope1+2
197.7
217.4
192.1
195.3
170.5
Scope3
-
-
1,880.8
1,857.5
2,569.0
1 Purchased goods / services
-
-
1,214.8
1,321.4
1,940.7
2 Capital goods
-
-
65.5
7.0
3.9
3 Fuel and energy related activities
-
-
12.2
12.7
25.5
4 Transportation and delivery (Upstream)
-
-
8.7
9.4
11.0
5 Waste generated from business
-
-
116.0
98.6
109.5
6 Business trip
-
-
1.1
1.7
1.7
7 Employee commuting
-
-
61.9
19.6
17.8
8 Leased assets (upstream)
-
-
0.1
0.2
0.2
9 Transportation and delivery (downstream)
-
-
44.9
38.0
44.3
10 Processing of sold products
-
-
0.0
0.0
0.0
11 Use of sold products
-
-
319.0
314.5
371.8
12 End-of-life treatment of sold products
-
-
36.5
34.3
42.5
13 Leased assets (downstream)
-
-
0.1
0.1
0.1
14 Franchises
-
-
0.0
0.0
0.0
15 Investments
-
-
0.0
0.0
0.0
Construction waste (Excluding construction sludge)
1,000t
1,564.3
1,343.5
1,302.5
1,022.9
1,152.6
Construction sites
1,563.0
1,342.0
1,301.0
1,021.0
1,151.0
Reuse / reduction
1,520
1,296
1,255
980
1,120
Final disposal
43
46
46
41
31
Office,etc.
1.3
1.5
1.5
1.9
1.6
Reuse / reduction
1.2
1.3
1.4
1.7
1.2
Final disposal
0.1
0.1
0.1
0.2
0.4
Construction sludge
961
999
735
822
751
Reuse / reduction
898
982
716
811
736
Final disposal
63
17
19
11
15
Surplus soil from construction
1,000m³
733
296
793
352
435
Reuse / reduction
733
296
793
352
435
Final disposal
0
0
0
0
0
Applicable Group Companies(Exclude companies that their business run in Obayashi's office)
Construction Business
Obayashi Road Corporation, Naigai Technos Corporation, Obayashi Facilities Corporation, Oak Setsubi Corporation, Tokken Corporation, Soma Environmental Service Corporation,
ATELIER G&B Co., and Obayashi Design Partners
Real Estate Business
Obayashi-Shinseiwa Real Estate Corporation
Other Businesses
Information:Oak Information System Corporation
Golf course: Ibaraki Green Co., Ltd.
Restaurant:Le Pont de Ciel Co., Ltd.
Renewable energy generation:Obayashi Clean Energy Corporation
Environmental policy includes support for Group companies in order to lower the environmental impact of the entire Obayashi Group. In line with this policy, the Group Company Environmental Activity Liaison
Conference was formed to deal with issues for the entire Group. In addition, individual companies use their business activities for developing recyclable materials and increasing their use, combating the heat island
effect, conserving energy for building operations, and other purposes.
Basic Unit for Calculating Environmental Protection Benefits (FY2021.3)
For the cost of pollution prevention and protecting the global environment, the portion of these costs accounted for by construction sites is estimated by using figures from sample sites, construction sales during the fiscal year and other data.
The portion of resource recycling costs accounted for by the processing and disposal of construction waste materials from construction sites is the actual amount according to the manifestmultiplied by an average processing unit price for each item at individual branches (cost includes construction sites of Obayashi alone and all costs at joint construction projects where Obayashiis the main contractor)
Electric power
Diesel fuel
Kerosene
Gas
Primary energy (*22)
9.97MJ/kWh
37.7MJ/L
36.7MJ/L
44.9MJ/m³
CO2(*23)
By electric utility company (*25)
2.58kg-CO2/L
2.49kg-CO2/L
2.23kg-CO2/Nm³
SOX(*24)
0.335
0.069
0.007
0
g-SOX/kWh
g-SOX/MJ
NOX(*24)
0.778
0.463
0.069
0.058
g-NOX/kWh
g-NOX/MJ
*22 Electricity: Ordinance for Enforcement of the Act on the Rational Use of Energy. All others except electricity: Calculation Methods and Emission Coefficients for Calculation, Report and Announcement Systems(after 2014.3 revisions)
*23 Calculation Methods and Emission Coefficients for Calculation, Report and Announcement Systems (after 2014.3 revisions)
*24 Building Life Cycle Assessment Guidelines, Architectural Institute of Japan (after 2013.2 revisions)
*25 Emission coefficients for individual electric utilities
Power companies
Effective emission factor
The Chugoku Electric Power CO., Inc.
Effective emission factor
(kg-CO2 /kWh)
(kg-CO2 /kWh)
Hokkaido Electric Power CO., Inc.
0.593
The Chugoku Electric Power CO., Inc.
0.561
Tohoku Electric Power CO., Inc.
0.519
Shikoku Electric Power CO., Inc.
0.382
TEPCO Energy Partner, Inc.
0.457
Kyushu Electric Power CO., Inc.
0.344
Chubu Electric Power CO., Inc.
0.431
The Okinawa Electric Power CO., Inc.
0.810
Hokuriku Electric Power Company
0.510
Alternative
0.470
The Kansai Electric Power CO., Inc.
0.340
CO2 emission coefficients for individual electric utilities (Announced on 2021.01.07), Ministry of the Environments
*27 Figures under each year are the ratio of those among regular recruits who resigned within three years of hire
*28 Includes turnover due to other than personal reasons
*29 Figures are ratio of turnover of new employees of three years ago who quit the Company within three years
Equal Opportunity and Diversity
(As of fiscal years ended March 31)
Unit
FY2017.3
FY2018.3
FY2019.3
FY2020.3
FY2021.3
Number of managers
(of which, number of senior managers)
person
5,028 (995)
5,093 (1,094)
5,126 (1,109)
5,160 (1,226)
5,232 (1,318)
male
4,649 (991)
4,685 (1,090)
4,674 (1,103)
4,698 (1,218)
4,747 (1,306)
female
379(4)
408(4)
452(6)
462(8)
485(12)
Number of directors
(of which, number of executives)
person
66(50)
67(52)
65(50)
67(52)
71(54)
male
65(49)
66(51)
64(49)
67(52)
69(54)
female
0
0
0
0
2
KPI
Ratio of female managers
%
7.5
8.0
8.8
9.0
9.3
KPI
Ratio of female engineers
%
8.8
9.0
9.3
9.5
9.8
Number of foreign national employees
Consolidated
person
2,999
3,063
3,269
3,322
3,309
Obayashi (of which, number of Manager)
25(1)
22(3)
23(5)
24(7)
25(9)
Group Companies
2,974
3,041
3,246
3,298
3,284
Number of foreign national students
2
1
1
2
2
Number of people with disabilities
person
207
200
213
217
238
KPI
Ratio of people with disabilities
%
2.15
2.07
2.20
2.23
2.35
Number of rehired employees
person
789
705
673
669
670
Ratio of rehired employees (*30)
%
88.3
88.5
92.3
93.5
91.3
*30 Applicant rehiring rate is 100%
Work-life Balance
(As of fiscal years ended March 31)
Unit
FY2017.3
FY2018.3
FY2019.3
FY2020.3
FY2021.3
Ratio of employees who took their annual paid vacation
%
41.7
43.1
43.9
41.9
56.0
Yearly average day of yearly paid vacation days taken
day
7.9
8.1
8.3
8.4
11.1
Ratio of employees who worked within the target of yearly maximum overtime hours (960 hours/year)
%
90.0
91.1
94.4
94.1
94.5
Hours of total working hours per employee
hours/year
2,242.2
2,246.7
2,235.6
2,195.0
2,218.1
KPI
Ratio of practice of closing construction sites eight days out of every four-week period
%
-
-
-
23.4
28.5
Number of employees taking childcare leave
person
34
40
37
49
56
male
person
1
2
2
4
8
On leave (*31)
%
0.4
0.6
0.6
1.1
2.4
Who returned to work (*32)
100
100
100
100
100
female
person
33
38
35
45
48
On leave
%
97.3
92.7
100
100
100
Who returned to work
94.7
100
100
97.1
100
KPI
Ratio of eligible male employees taking childcare leave or other leave for the purpose of childcare
%
-
-
-
13.5
12.8
Number of employees taking short working hours for
person
154
146
157
150
141
Number of employees taking nursing leave (*33)
47
56
62
57
27
Number of employees taking nursing-care leave (*33)
20
23
37
16
18
Number of employees taking leave for volunteer activities
3
3
5
2
2
Number of employees taking maternity leave
48
39
35
45
59
Spouse-giving-birth vacation (*34)
157
146
193
207
197
*31 Number of employees taking childcare leave / Number of babies born within the fiscal year
*32 Number of employees who actually returned to work
*33 Other than legal nursing leave days and nursing-care leave days, employees benefit from their accumulated vacation day carryovers
*34 Partners can take a leave when their spouse is giving a birth (Only accumulated vacation day carryovers were allowed before June 2015)
Note that we also have leave for public duty, marriage, death in the family, menstruation, paid vacation days for employees working at construction sites, vacations when transferring to other work sites, vacation days awarded to 12th, 22th, 32nd year continuous work employees, and special leaves.
Construction materials green procurement rate (*37)
%
40.9
43.1
43.2
43.1
47.5
Green procurement amount
millions of yen
54,848
63,563
56,361
53,411
51,343
Construction material
54,630
63,300
56,089
53,160
51,128
Recycled paper
47
47
42
38
26
Office supplies (*38)
38
43
39
26
22
Sitewear
133
173
191
187
167
KPI
Total number of Certified Excellent Site Supervisors/Excellent Operators
person
346
389
427
456
458
KPI
Number of persons completing training at the Obayashi Rin-yu-kai Vocational Training School
person
18
42
93
74
44
*37 Calculation formula: Green procurement = Green procurement cost / total cost of construction equipments
Green procurement include: treated soil, construction waste soil, recycled concrete aggregate, recycled asphalt and concrete, blast furnace cement concrete, blast furnace raw concret,steel scrap, and polycarbonate (Precast concrete)
*38 Calculated using the Biznet procurement system for office supplies, etc.
Materialites, Action Plans, Targets and Results for KPIs
Environment
Action plan
KPI
Results for FY2020.3
Results for FY2021.3
Targets for FY2022.3
Establish an Environmentaly Responsible Society
Promote environmentally friendly businesses
Ratio of design and construction projects (of 2.000m² and up) with CASBEE ranking of A or higher
75%
64%
At least 70%
Ratio of sustainability-related capital expenditure to real estate leasing business capital expenditure
92.7%
93.6%
At least 90%
Promote renewable energy business
Electricity generated annually as a result of renewable energy business
255,551MWh
267,202MWh
At least 370,000MWh
Promote decarbonization
Direct contribution of CO2 emissions reduction rate (vs FY2014.3)
▲58%
▲67%
85% reduction by FY2031.3
lndirect contribution of CO2 emissions reduction rate (vs FY2014.3)
▲21%
▲21%
25% reduction by FY2031.3
Contribute to realizing a recycling- oriented society
Emissions of construction waste material per unit value of completed construction work
17.8t/billion yen
12.7t/billion yen
14.0t/billion yen
Social
Action plan
KPI
Results for FY2020.3
Results for FY2021.3
Targets for FY2022.3
Enhance Quality Control and Technological Capabilities
Pursue reliable quality
Customer satisfaction rate
85.4%
96.8%
100%
Use technological capabilities to further enhance productivity
Construction business productivity increase rate (vs FY2017.3)
2.0%
4.4%
At least 10%
Maintain good construction
Ratio of workers with important construction management credentials: professional engineer, registered
first-class architect, and registered first-class construction management engineer (building construction, civil engineering, plumbing work, and electricity work)
80.2%
80.5%
Maintain at least 80%
Ensure Occupational Health and Safety
Rigorously apply the Occupational Health and Safety Management System (OHSMS)
Number of fatal accidents
1 cases
2 cases
0 cases
Degree of achievement of the Occupational Health and Safety Management System evaluation terms
83.3%
85.3%
At least 90%
Develop and Retain Human Resources
Promote work style reform
Ratio of practice of closing construction sites eight days out of every four-week period
23.4%
28.5%
100%
Ratio of eligible male employees taking childcare leave or other leave for the purpose of childcare
13.5%
12.8%
100% by FY2024
Promote diversity
Ratio of employment of people with disabilities
2.2%
2.3%
At least 2.4%
Ratio of female managers
9.0%
9.3%
Around 12% by FY2024
Ratio of female engineers
9.5%
9.8%
Around 12% by FY2024
Governance
Action plan
KPI
Results for FY2020.3
Results for FY2021.3
Targets for FY2022.3
Implement Rigorous Compliance
Promote the Corporate Ethics Program
Ratio of employees taking corporate ethics training
100%
100%
100%
Practice rigorous information security management
Ratio of employees taking information security training